Prime ML + Totals Backtest Dashboard
Synthetic +5% offered-odds backtests on model-selected lines, plus matched model-vs-book checks and total-goals distribution diagnostics.
Moneyline Read
6.48%
2.64%
0.6868
0.7133
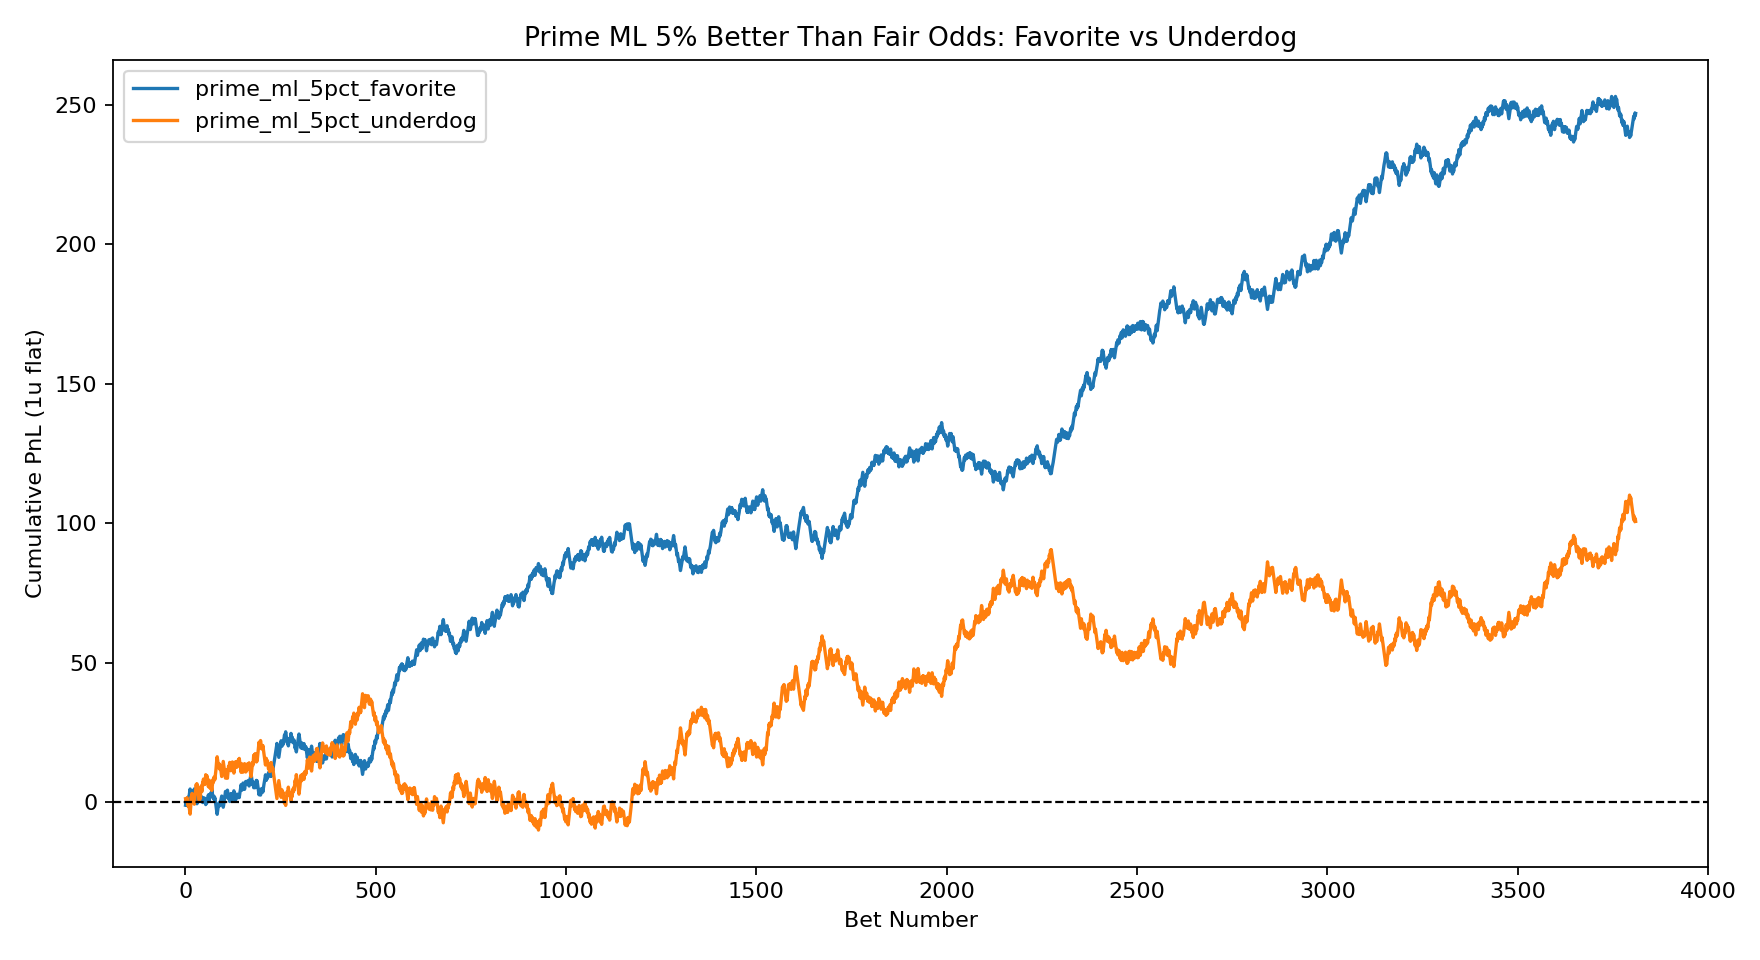
Moneyline +5% Cumulative PnL
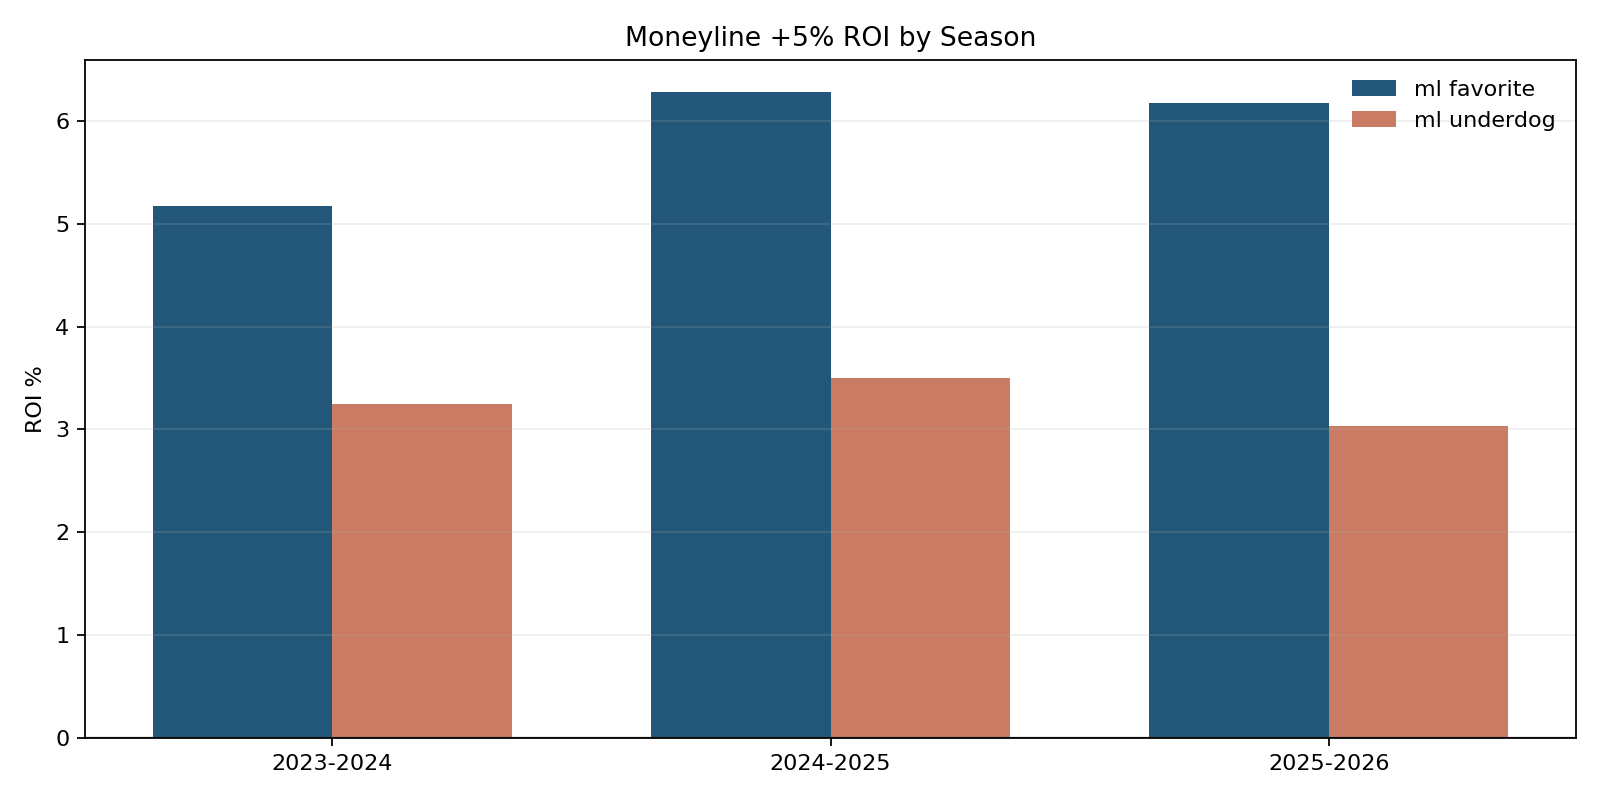
Moneyline +5% ROI by Season
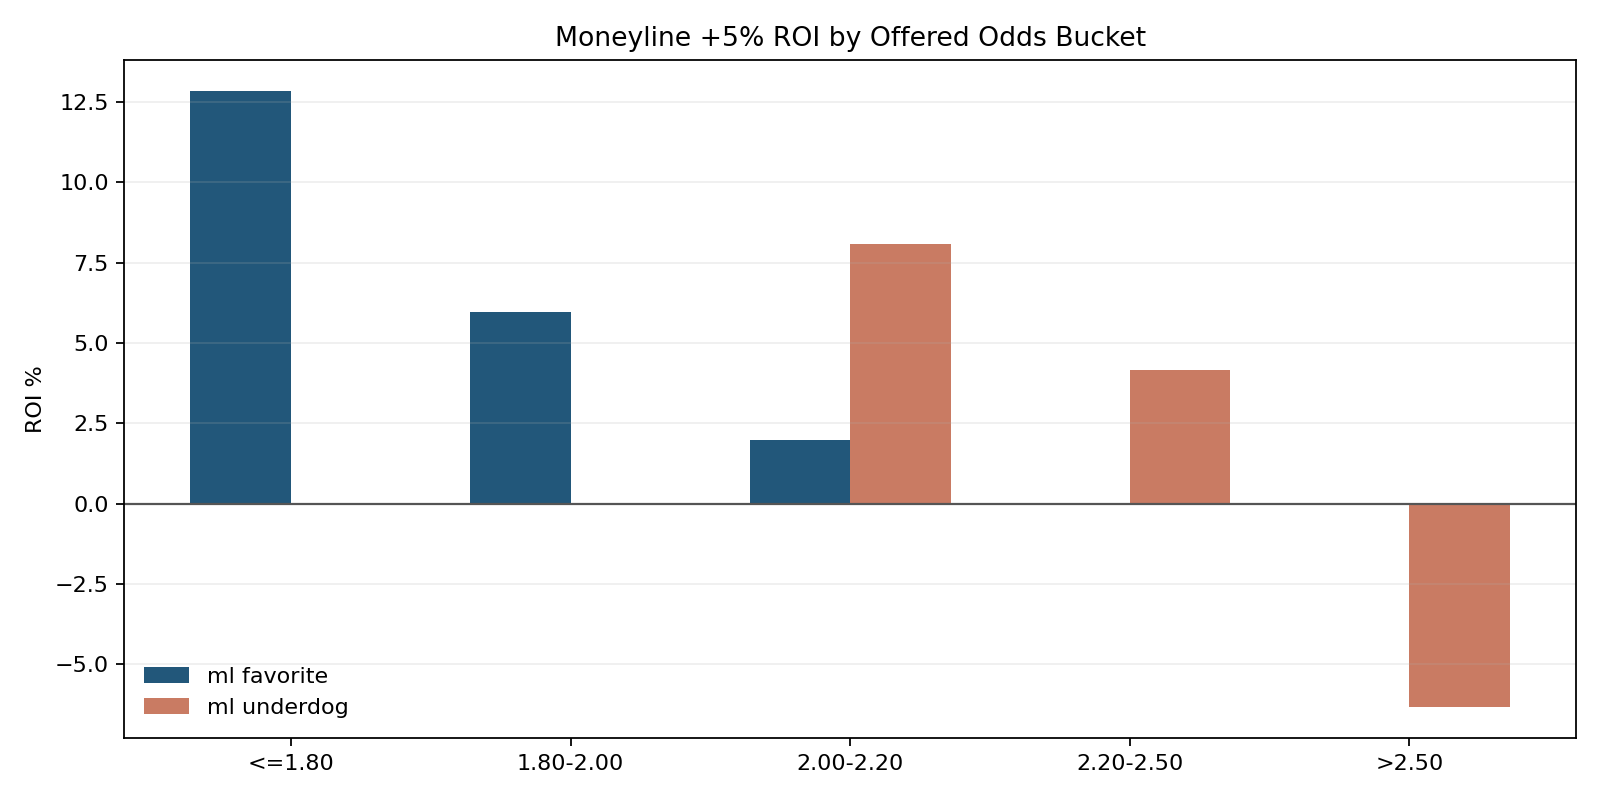
Moneyline +5% ROI by Odds Bucket
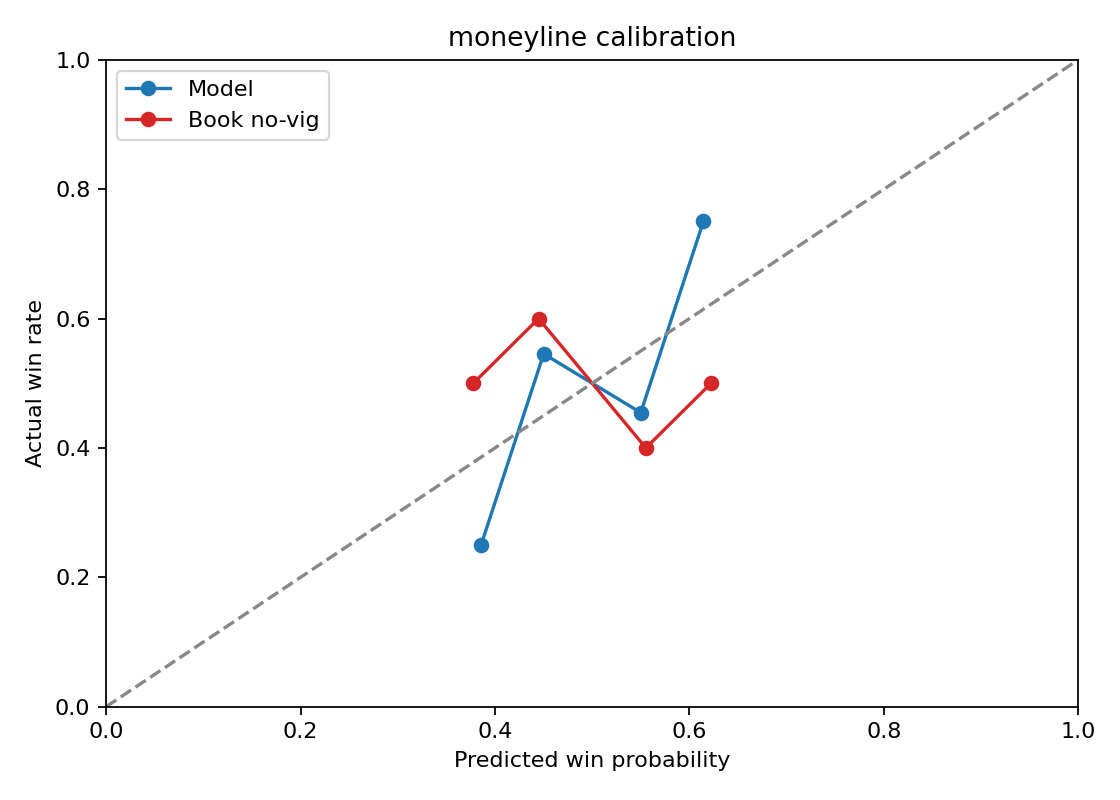
Moneyline Model vs Book Calibration
Totals Read
5.20%
4.97%
0.6813
-10.47%
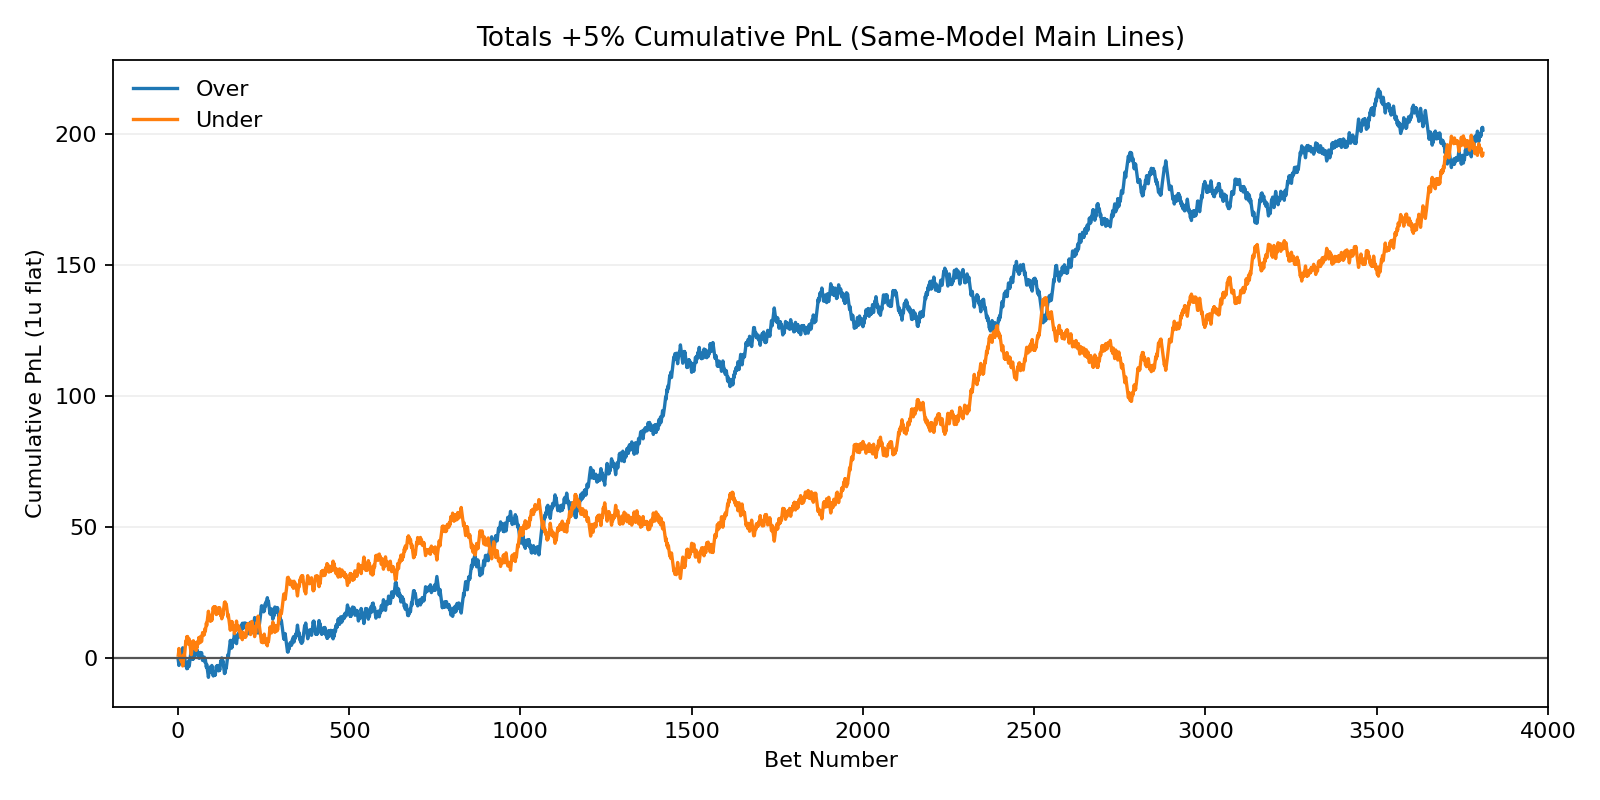
Totals +5% Cumulative PnL
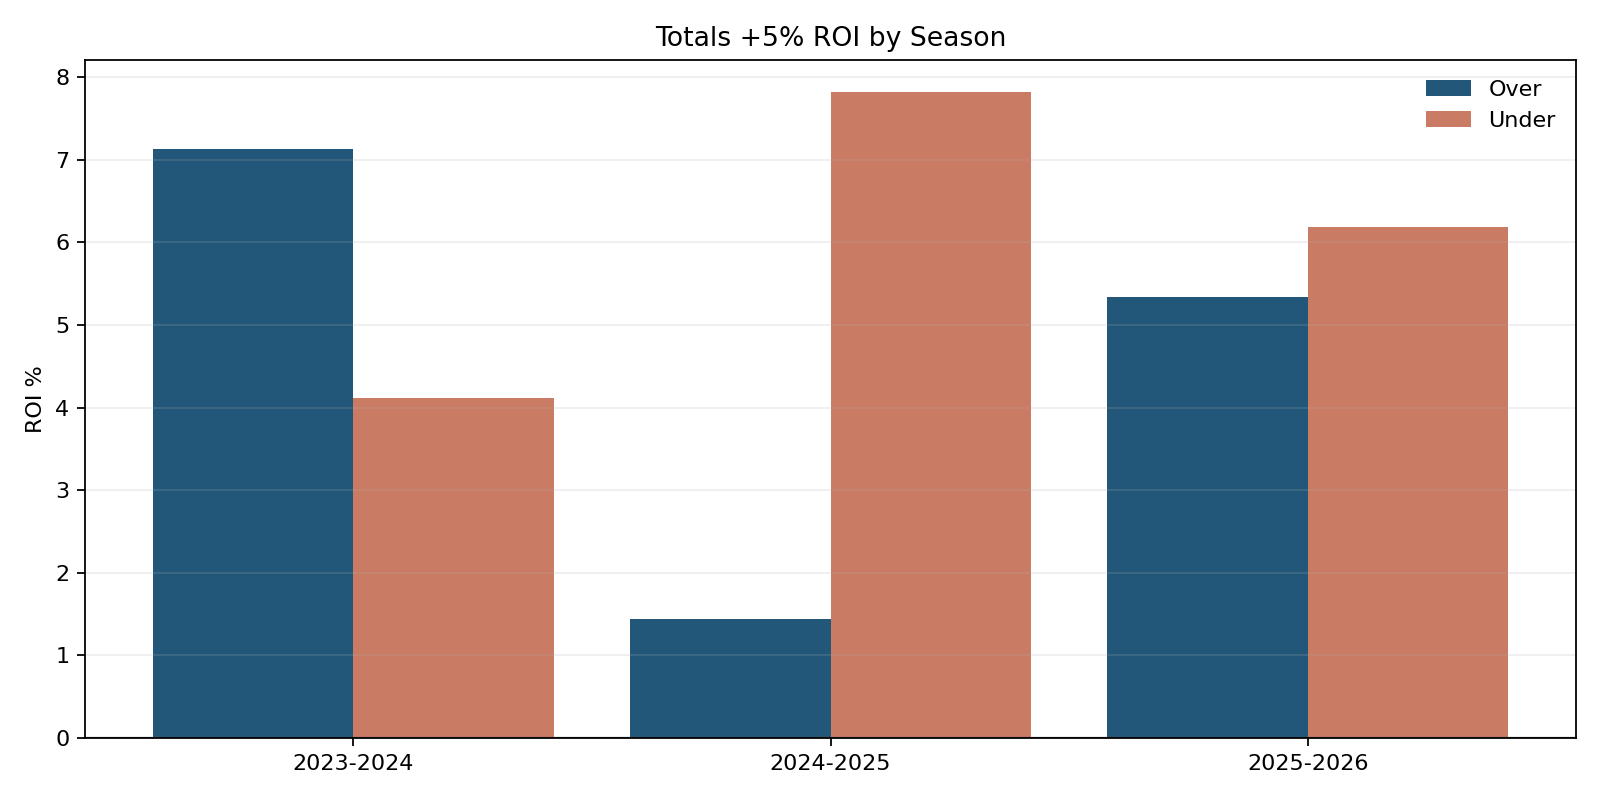
Totals +5% ROI by Season
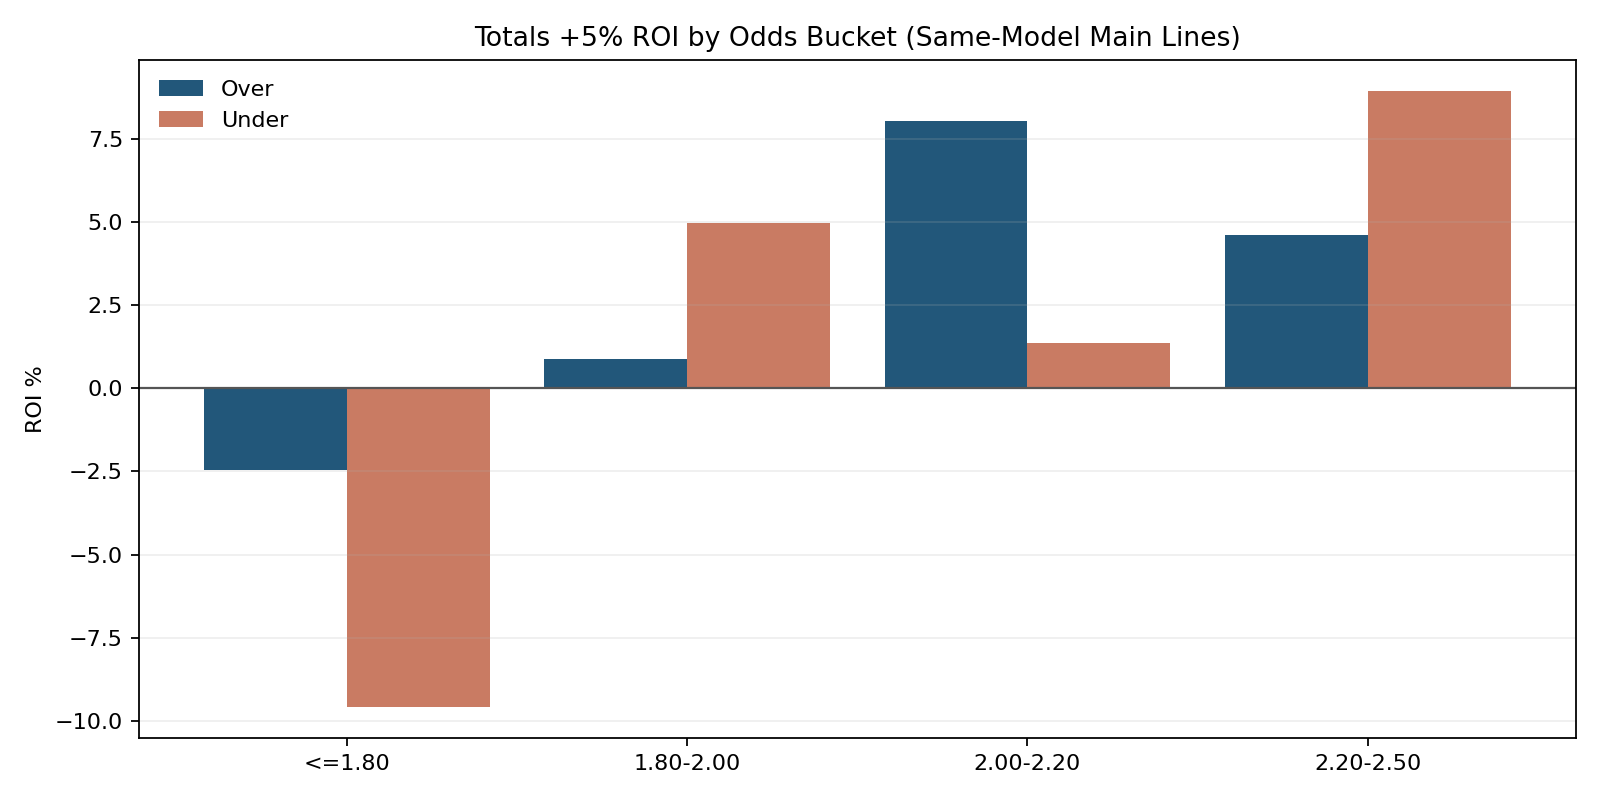
Totals +5% ROI by Odds Bucket
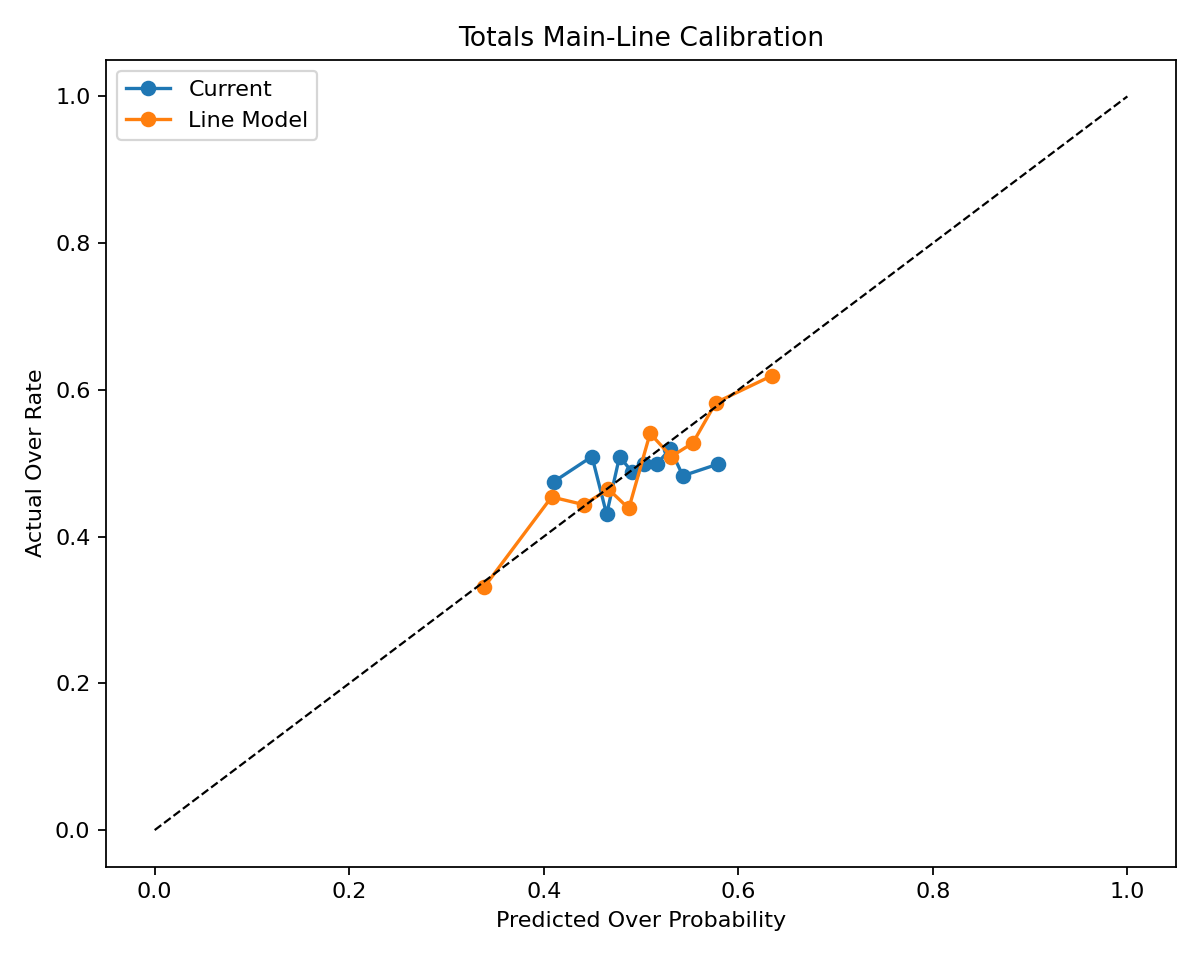
Totals Model-Selected Main-Line Calibration
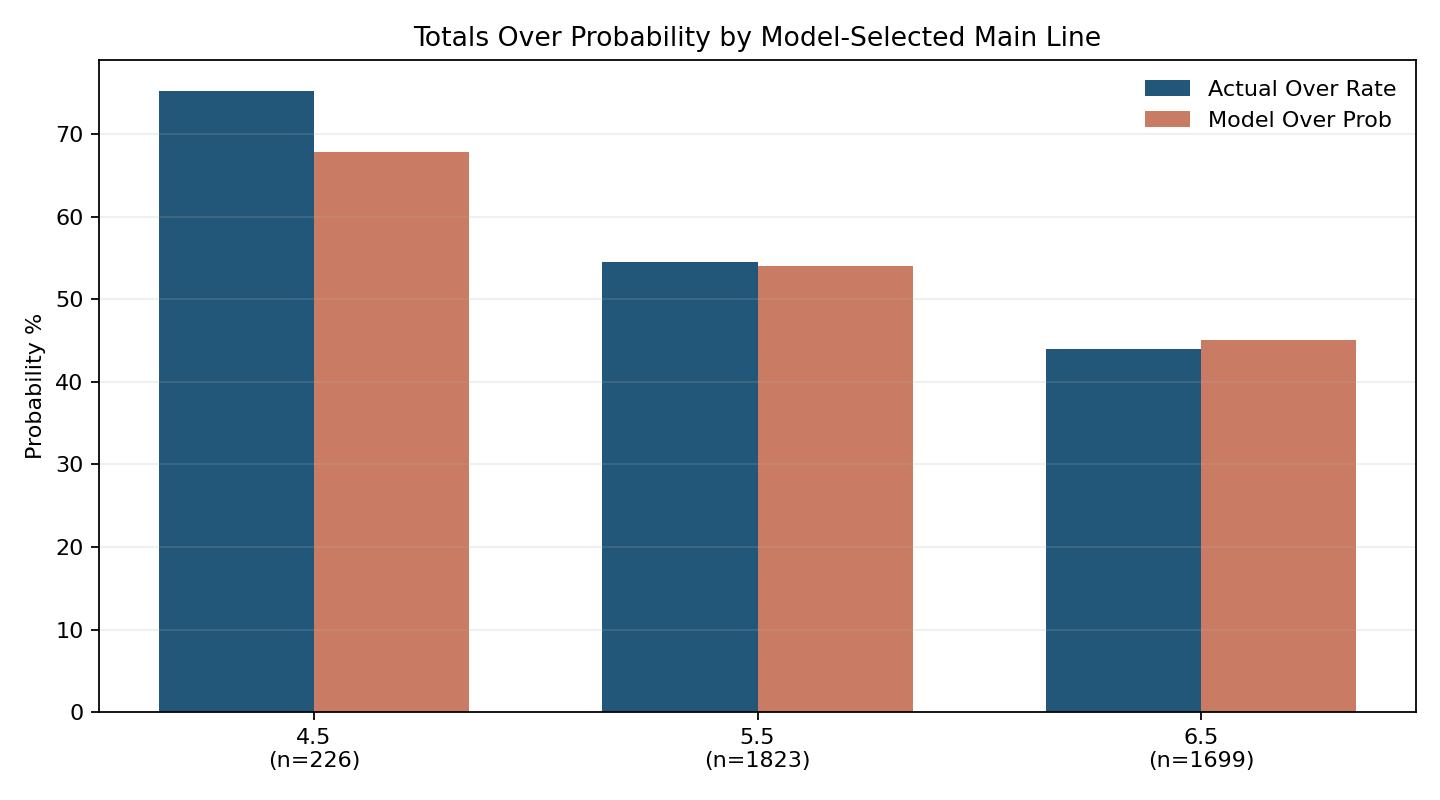
Totals Over Probability by Model-Selected Main Line
Line Read
The totals charts on this page now use the proper same-model synthetic framework: the promoted totals model selects its own near-even line, then synthetic bookie odds are built from that same model fair. The old mixed-selector framework is no longer used here.
The live totals build now also includes a mild global confidence shrink and an `Under 6.5` fair-odds floor, specifically to stop the model from overclaiming the short-fair under tail that was failing the earlier audit.
The useless `>2.50` tail bucket is omitted from the displayed odds-bucket chart because it is tiny on the proper same-model main-line test and was previously encouraging the wrong interpretation. On the matched closing main-line sample, overs still look better than unders: over ROI at a 5% edge threshold is 10.56% on 16 bets, while under ROI is -10.47% on 36 bets.
The main contradiction remains the short-fair `Under 6.5` tail. In the proper synthetic test, the `fair <= 1.50` pocket still runs at nan% ROI, which is why giant live `Under 6.5` claims should still be treated with caution.
Totals Distribution Comparison
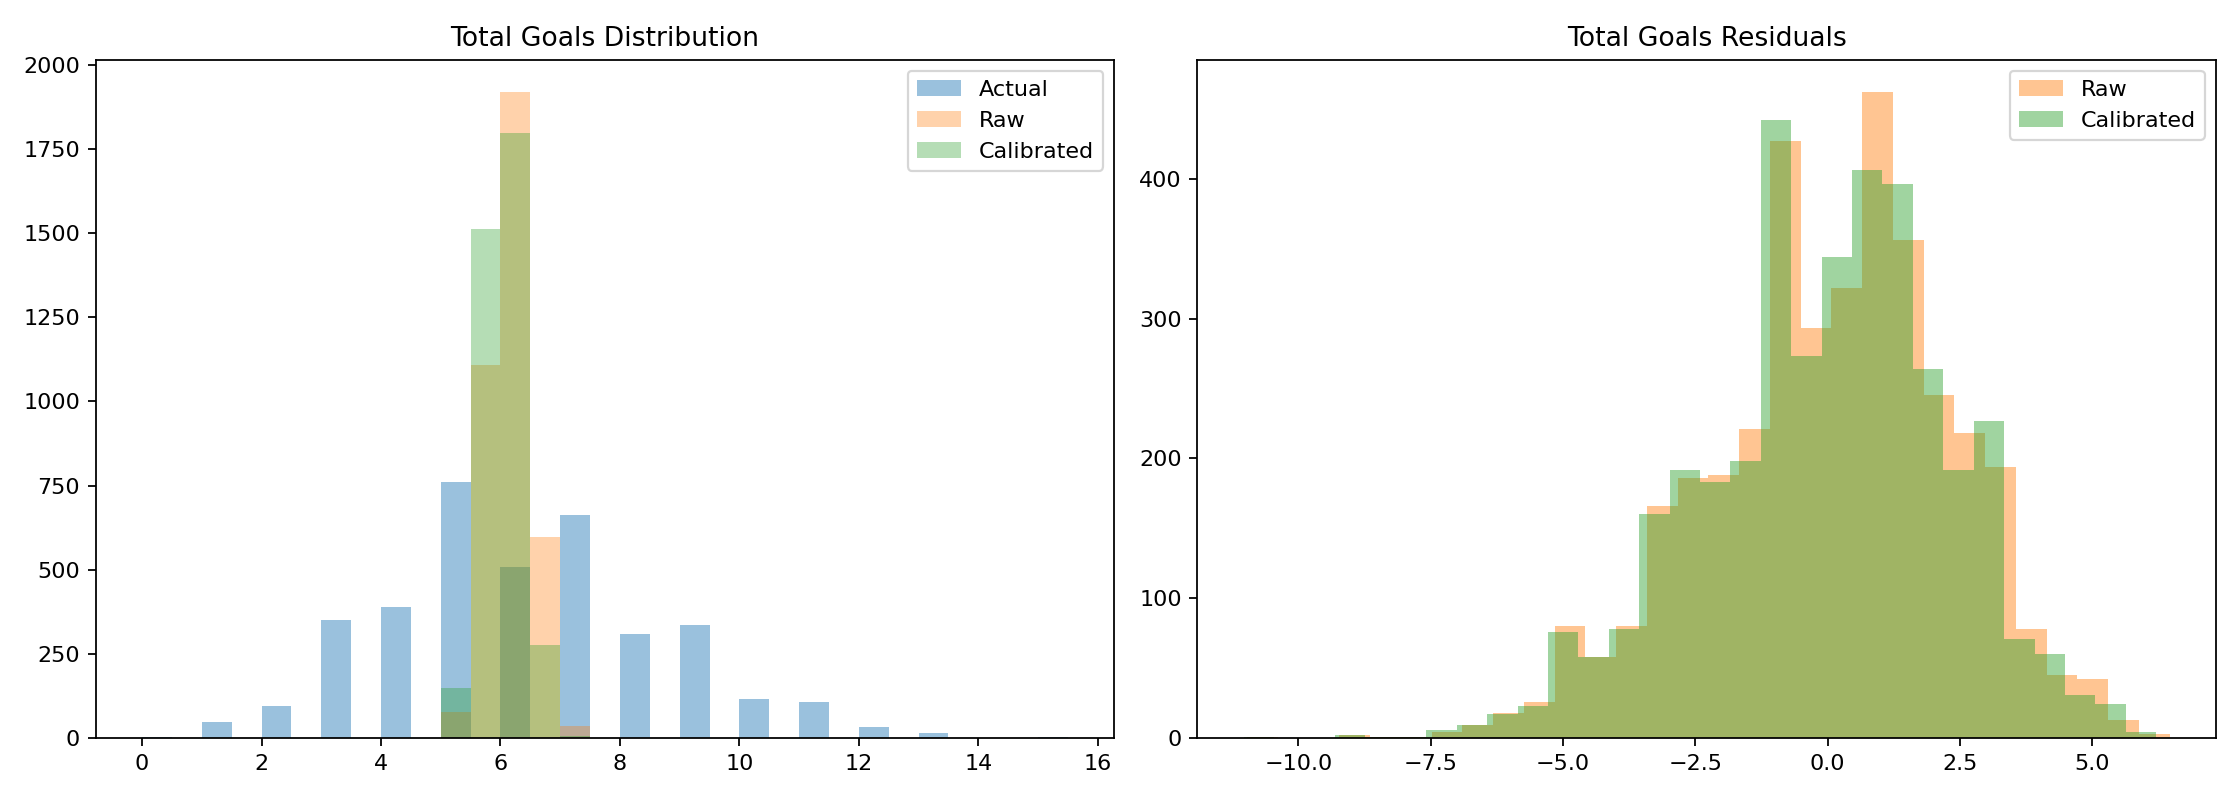
Distribution Note
The raw scalar totals forecast is still under-dispersed. The calibrated totals-goals mean has predicted standard deviation 0.31 versus actual 2.31, which is why the model behaves much better on unders than overs.
The promoted totals model is the line-family + goalie version currently running in prime. The matched book sample is still small, so this page prioritizes the larger synthetic backtest view.